Speedy DORA roll-up: what to standardize org-wide?
Categories DORA
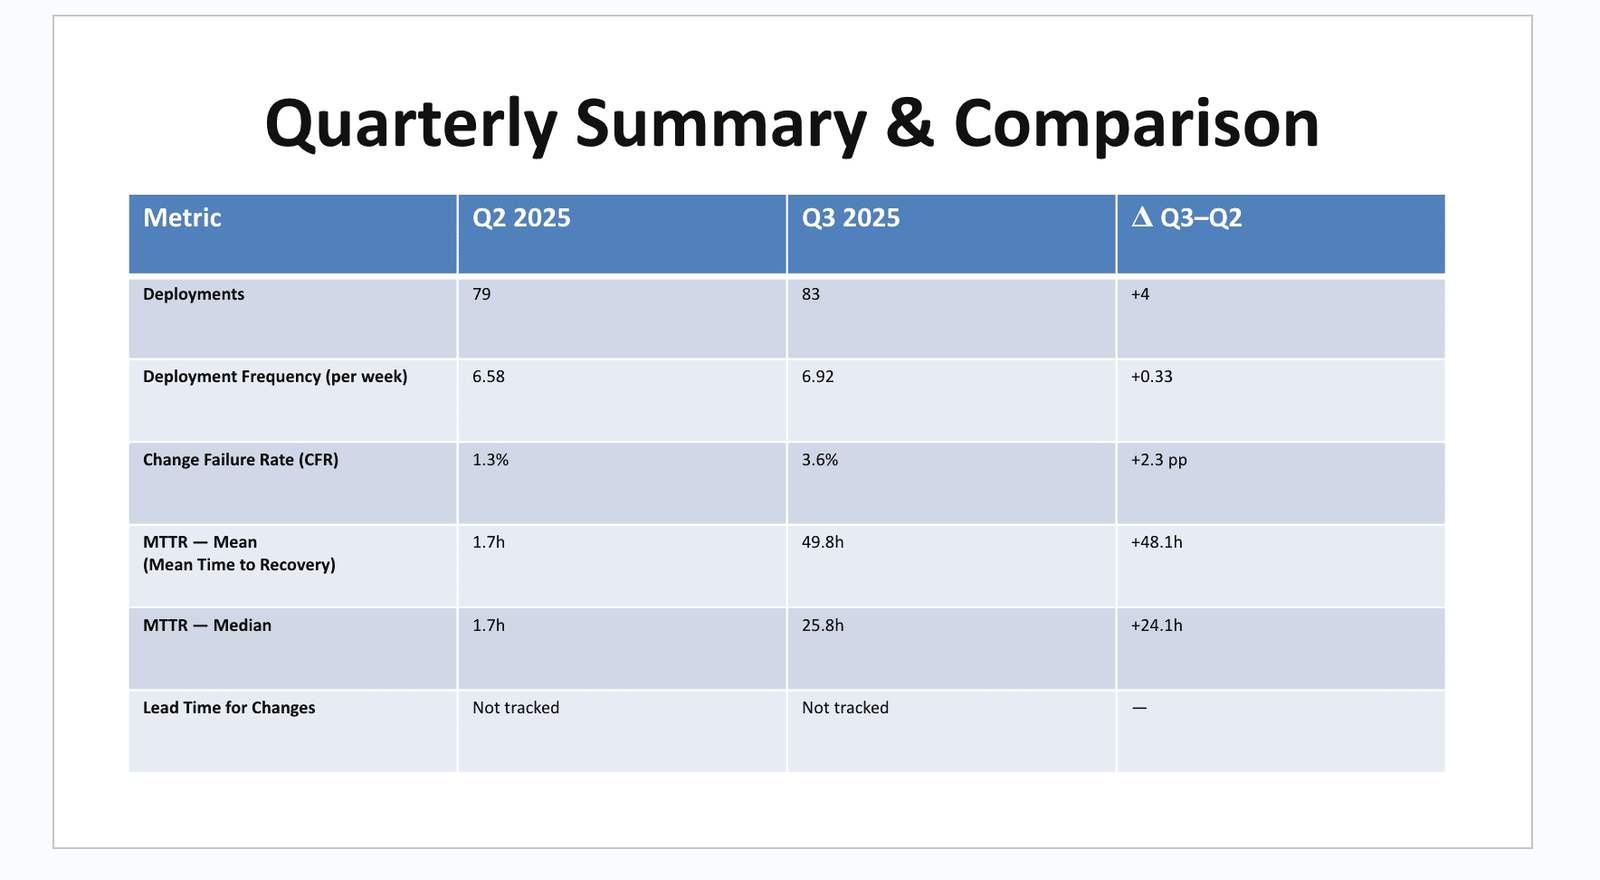
Table of Contents
TL;DR: If you’re rolling up DORA across teams, prioritize MTTR median + change size over raw frequency; run a 30-min MTTR review after every incident.
Try this week: add a pre-merge risk checklist and hold an MTTR review within 48h.
Context: I pulled Q2→Q3 DORA (DevOps Research & Assessment) metrics for our team (13 weeks each) and shared a simple dashboard with peer leaders. The method works with any CI + incident system and scales to an org roll-up when definitions are consistent.
What I did to add DORA analytics
- Set a fixed 13-week window (Q2 vs Q3 2025); UTC timestamps only.
- DORA Definitions used:
- Deployment Frequency = prod releases/week from CI/CD (retries deduped).
- CFR (Change Failure Rate) = % of deployments that caused a customer-impacting incident or rollback within 7 days.
- MTTR (Mean Time To Restore) = incident start→resolved; we report median and mean, and also an adjusted MTTR (exclude incidents >72h) to highlight long-tail risk—not to replace the median.
- Linked incidents to the prior deployment (or explicit deployment_id) and tagged by workstream/owner.
- Shared results with a VP of Engineering and Heads of departments
Baseline & results
Window: Q2 vs Q3 2025 (13 weeks each). n: Deployments Q2=79, Q3=83; incidents with customer impact in Q3=3 (one 5-day outlier).
| Metric | Window (n) | Baseline → Result | Method/Definition | Note |
|---|---|---|---|---|
| Deployment Frequency | 13 wks (n=79→83) | 6.58 → 6.92 /wk | Count prod releases/week | Top-quartile frequency; verify against seasonality |
| Deployments (count) | 13 wks | 79 → 83 | CI/CD release count | +4 releases |
| CFR (Change Failure Rate) | 13 wks | 1.3% → 3.6% | Incidents/Deploys (≤7 days) | Below org average |
| MTTR — Median | 13 wks (n=3) | 1.7h → 25.8h | Incident start→resolved | Skewed; use median |
| MTTR — Mean | 13 wks | 1.7h → 49.8h | As above | Inflated by 5-day outlier |
| Lead Time for Changes | 13 wks | Not tracked → tracking in Q4 | PR merge→prod | Baseline pending |
Org readers: copy this structure, keep your linking rule and MTTR start/stop identical quarter-to-quarter, and publish MTTR P50/P90 next time.
Interpretation
- For org roll-ups, lead with MTTR median and CFR; qualify frequency. Frequency without change size/rollback paths risks vanity metrics.
- Sample size note: n=3 incidents → treat MTTR trends as directional; set a rule of thumb: don’t draw strong MTTR conclusions until n≥10/quarter.
- Removing the 5-day outlier, adjusted MTTR ≈10.7h—still not top-quartile for web apps (practical range many teams target: ~5–12h).
What I want to do now
- Adopt a 48h MTTR review standard (org-wide). 30 minutes, blameless, produce 1–3 operational fixes and a runbook update. Expected effect: MTTR median <12h.
- Adopt a PR risk checklist (org-wide). Require feature flags/kill-switch, rollback plan, observability, and max change size. Expected effect: keep CFR ≤2% while maintaining ≥7/wk frequency.
- Concentrated incidents: one workstream produced 2 incidents → blameless review with senior dev and QA. Expected effect: stream CFR ≤2%.
- Lead time gap: instrument PR-merge→prod and publish P50/P90. Expected effect: median lead time <1 day; exposes review/release bottlenecks.
- Release hygiene: avoid Friday cutovers unless flagged + on-call coverage. Expected effect: CFR controlled without reducing frequency.
How you can replicate (one-week plan)
- Choose the last 13 weeks; export deployment IDs (prod only) and incidents with start/resolved times.
- Normalize to UTC; define linking: incident ↔ nearest prior deployment within 7 days (or explicit deployment_id).
- Compute: deployments/week, CFR, MTTR median/mean; also adjusted MTTR (exclude >72h) for long-tail analysis.
- Tag incidents by service/workstream/on-call/PR author to find concentration.
- Produce a single page (table + two small charts).
- Host definitions in the same doc; don’t change them mid-quarter.
- Review with peers; agree on 1–3 changes tied to metrics; schedule an automated weekly refresh to Slack/Notion.
Paste-ready artifact — “Pre-merge risk checklist” (drop into your PR template)
[ ] Change is behind a feature flag or can be disabled at runtime
[ ] Rollback path documented (how + who + max time to rollback)
[ ] Observability in place (logs + metrics + alerts) for new paths
[ ] Change size within team standard (e.g., <300 LOC or split by flag)
[ ] Post-deploy smoke check defined (owner + steps)
[ ] Risk label set (Low/Med/High) and, if High, release window approved
[ ] Deployment ID will be attached to incident tickets automatically
Risks & gotchas with DORA analysis
- Small n distorts MTTR. Mitigation: headline the median, publish mean and adjusted MTTR; treat MTTR trends as directional until n≥10/quarter.
- Incidents not linked to deploys. Mitigation: require deployment ID in every incident; auto-attach from CI metadata.
- Friday freezes reduce throughput. Mitigation: exception process with flags + on-call coverage.
- Owner tagging creates blame. Mitigation: blameless reviews; use tags to target systemic fixes.
Next measurement
Re-measure on 03 Jan 2026 (or next quarter). Targets:
- Deployment Frequency ≥ 7.0/wk (13-week median).
- CFR ≤ 2.0%.
- MTTR median <12h (stretch: <6h); adjusted MTTR <8h.
- Lead Time (PR merge→prod) median <1 day.
Org note: we’ll publish org-level MTTR percentiles next quarter for benchmarking.
Appendix A — CFR & MTTR (Postgres)
Works on Postgres; adjust PERCENTILE_CONT syntax for other warehouses.
-- Window: Q3 2025
WITH window AS (
  SELECT TIMESTAMP '2025-07-01' AS start_ts, TIMESTAMP '2025-09-30' AS end_ts
),
deploys AS (
  SELECT id, service, deployed_at
  FROM deployments, window
  WHERE environment='prod'
    AND deployed_at >= start_ts AND deployed_at < end_ts
),
incs AS (
  SELECT id, service, started_at, resolved_at, deployment_id
  FROM incidents, window
  WHERE started_at >= start_ts AND started_at < end_ts
),
link AS (
  -- Link incidents to a deployment by explicit fk or nearest prior deploy within 7 days
  SELECT i.id AS incident_id, d.id AS deploy_id, i.started_at, i.resolved_at
  FROM incs i
  LEFT JOIN deploys d
    ON (i.deployment_id = d.id)
    OR (i.service = d.service AND d.deployed_at <= i.started_at
        AND i.started_at < d.deployed_at + INTERVAL '7 days')
),
mttr AS (
  SELECT
    PERCENTILE_CONT(0.5) WITHIN GROUP (
      ORDER BY EXTRACT(EPOCH FROM (resolved_at - started_at))/3600
    ) AS mttr_median_h,
    AVG(EXTRACT(EPOCH FROM (resolved_at - started_at))/3600) AS mttr_mean_h,
    COUNT(*) AS incidents_n
  FROM link
  WHERE resolved_at IS NOT NULL
),
cfr AS (
  SELECT
    COUNT(DISTINCT deploy_id)::float / NULLIF((SELECT COUNT(*) FROM deploys),0) * 100 AS cfr_pct
  FROM link
  WHERE deploy_id IS NOT NULL
)
SELECT
  (SELECT COUNT(*) FROM deploys) AS deployments_n,
  ROUND(((SELECT COUNT(*) FROM deploys)::float / 13.0), 2) AS deploys_per_week,
  ROUND((SELECT cfr_pct FROM cfr), 2) AS cfr_pct,
  ROUND((SELECT mttr_median_h FROM mttr), 1) AS mttr_median_h,
  ROUND((SELECT mttr_mean_h FROM mttr), 1) AS mttr_mean_h,
  (SELECT incidents_n FROM mttr) AS incidents_n;
Leave a Reply